
Reporting
How to build, customize, and export custom reports in the admin portal, plus an overview of the built-in time card, payroll, and invoice report views.
Hire2Hero has two kinds of reports: built-in report views that surface pre-defined data for time cards, payroll, and invoices, and custom reports that you build yourself by choosing a data source and mapping fields into a table layout.
Built-in report views
The Reports section of the sidebar contains three pre-built views that require no configuration:
| Report | What it shows | Sidebar path |
|---|---|---|
| Time Card Reports | Time card data for a selected period | Reports → Time Card Reports |
| Payroll Reports | Payroll run summaries | Reports → Payroll Reports |
| Invoice Reports | Invoice details and totals | Reports → Invoice Reports |
Open any of these from the sidebar to view the data. Use the filters at the top of each page to narrow by date range, client, or other available criteria.
Custom reports
Custom reports let you define exactly which fields appear in which columns, with optional per-row conditional logic. They're built in a visual table editor and can be exported to CSV.
Creating and editing custom reports requires the Write Report permission.
Custom reports are a Professional plan feature. On the Starter plan, the Read Report and Write Report permissions can't be granted to any role, so the Reports → Reports entry won't appear in the sidebar. The built-in report views above are available on every plan. To unlock the builder, upgrade from Billing & Payments.
Browse custom reports
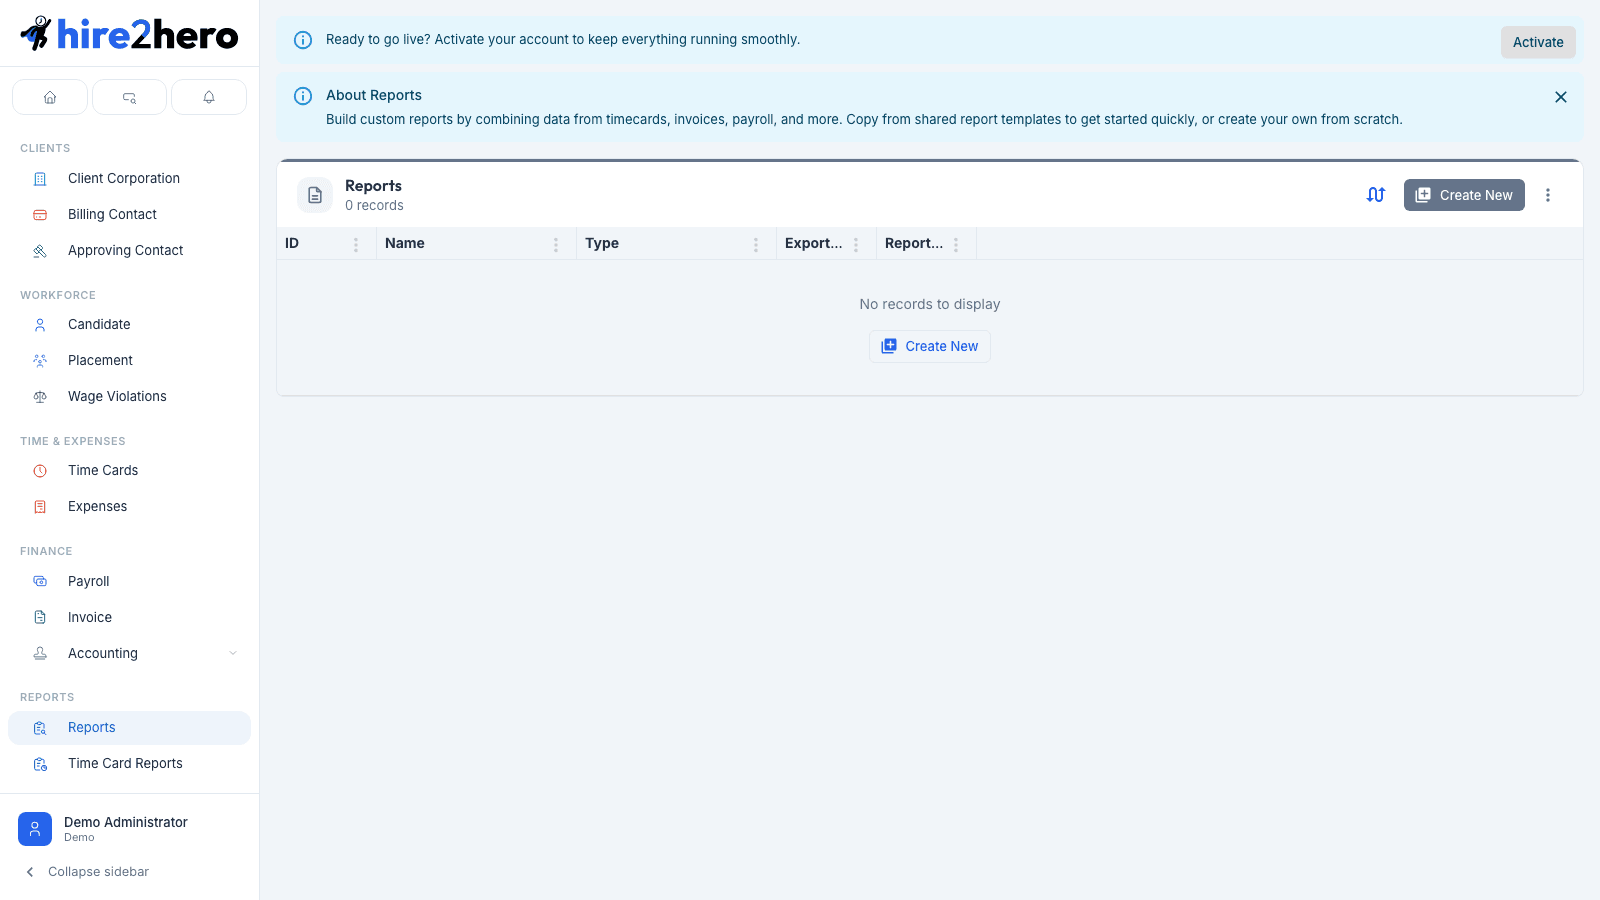
In the sidebar, choose Reports → Reports. The list shows all custom reports defined for your agency.
Create a custom report
Click + New in the toolbar.
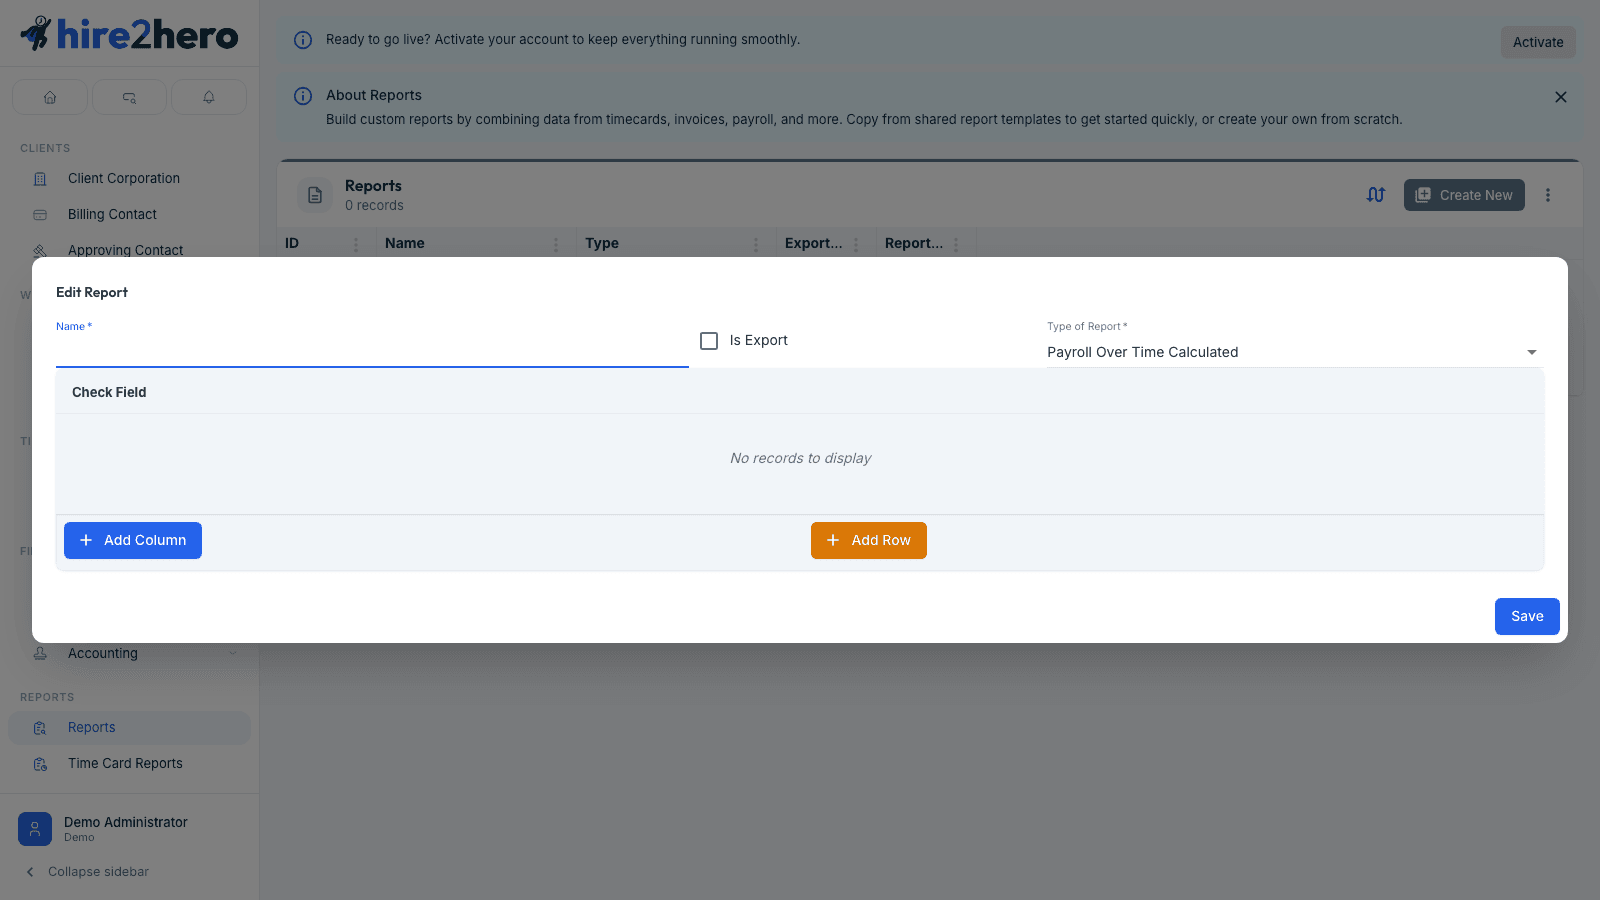
Enter a Name for the report.
Choose the Type of Report — this is the data source that determines which fields are available to map into columns and rows. For example, selecting a payroll source gives you fields like candidate name, pay rate, hours, and totals.
Toggle Is Exportable on if you want a CSV download button to appear when running this report.
Build the report table (see Report builder below).
Click Save.
Report builder
The report builder is a horizontally scrollable grid. Columns represent the output columns of your report; rows define how each line of data is generated.
Adding columns
Click Add Column (green button in the toolbar below the grid) to add a new column. Each column has a header field at the top — click it and use the field picker to choose the label or data field that appears as the column heading.
Adding rows
Click Add Row to add a new data row. Each row has:
- Check Field — an optional condition field on the left. When populated, the row only appears in the report output if the mapped field has a value. Leave it blank to always include the row.
- Column cells — one cell per column. Click each cell and use the field picker to choose which data field populates that column for this row.
Removing columns and rows
- Click the delete icon on a column header to remove that column (and its cells from every row).
- Click the delete icon on the right side of a row to remove that row.
Field picker
The field picker (used in headers, check fields, and cells) shows all fields available from the report's data source. You can combine literal text with dynamic fields to build formatted output — for example, a cell might show a currency-formatted number or a concatenated name.
Copy from Shared
Click Copy from Shared in the toolbar to open a gallery of shared report templates. Selecting a template creates a copy of it in your account that you can customize freely.
Shared templates are a good starting point. Copy one and adjust the columns and rows rather than building from scratch.
Save as New
Once a report has been saved at least once, a Save as New button appears alongside Save. Use it to create a copy of the current report under a new name — useful for building variations of an existing report without overwriting it.
Run and export a report
Click any report row in the list to open it. The report renders its output based on the configured rows and fields. If the report has Is Exportable enabled, a download button appears to export the results as CSV.